Who is Vegetarian?
Taketo Muroya
It is also important to know what kind of persons are actually vegetarian or vegan. The next graph shows the percentage of vegetarian or vegan in the U.S. by age, income, and political ideology (Gallup 2018).
# load data
consumer <- read.csv("data//consumer.csv")
# https://news.gallup.com/poll/238328/snapshot-few-americans-vegetarian-vegan.aspx

# change the order
consumer <- transform(consumer, category=factor(category,
                      levels=c("18-29", "30-49", "50-64", "65+",
                               "$0-$30K", "$30K-$75K", "$75K+",
                               "Conservative", "Moderate", "Liberal")))

consumer <- transform(consumer, group=factor(group, levels=c("vegetarian", "vegan")))

# visualization
p1<-ggplot(consumer[1:8,], aes(x=category, y=value, fill=group))+
  geom_bar(position="dodge", stat="identity", alpha=0.5)+xlab('')+
  ylab('percentage')+ggtitle("Age")+theme(legend.title=element_blank())+
  scale_fill_manual(values = c("#59A14F","#EDC948"))+theme_hc()+
  scale_y_continuous(breaks=seq(0,10,length=6))+coord_cartesian(ylim=c(0,10))

p2<-ggplot(consumer[9:14,], aes(x=category, y=value, fill=group))+
  geom_bar(position="dodge", stat="identity", alpha=0.5)+xlab('')+ylab('')+
  ggtitle("Annual Income")+theme(legend.title=element_blank())+
  scale_fill_manual(values = c("#59A14F","#EDC948"))+theme_hc()+
  scale_y_continuous(breaks=seq(0,10,length=6))+coord_cartesian(ylim=c(0,10))

p3<-ggplot(consumer[15:20,], aes(x=category, y=value, fill=group))+
  geom_bar(position="dodge", stat="identity", alpha=0.5)+xlab('')+ylab('')+
  ggtitle("Political Ideology")+theme(legend.title=element_blank())+
  scale_fill_manual(values = c("#59A14F","#EDC948"))+theme_hc()+
  scale_y_continuous(breaks=seq(0,10,length=6))+coord_cartesian(ylim=c(0,10))

gridExtra::grid.arrange(p1, p2, p3, nrow = 1)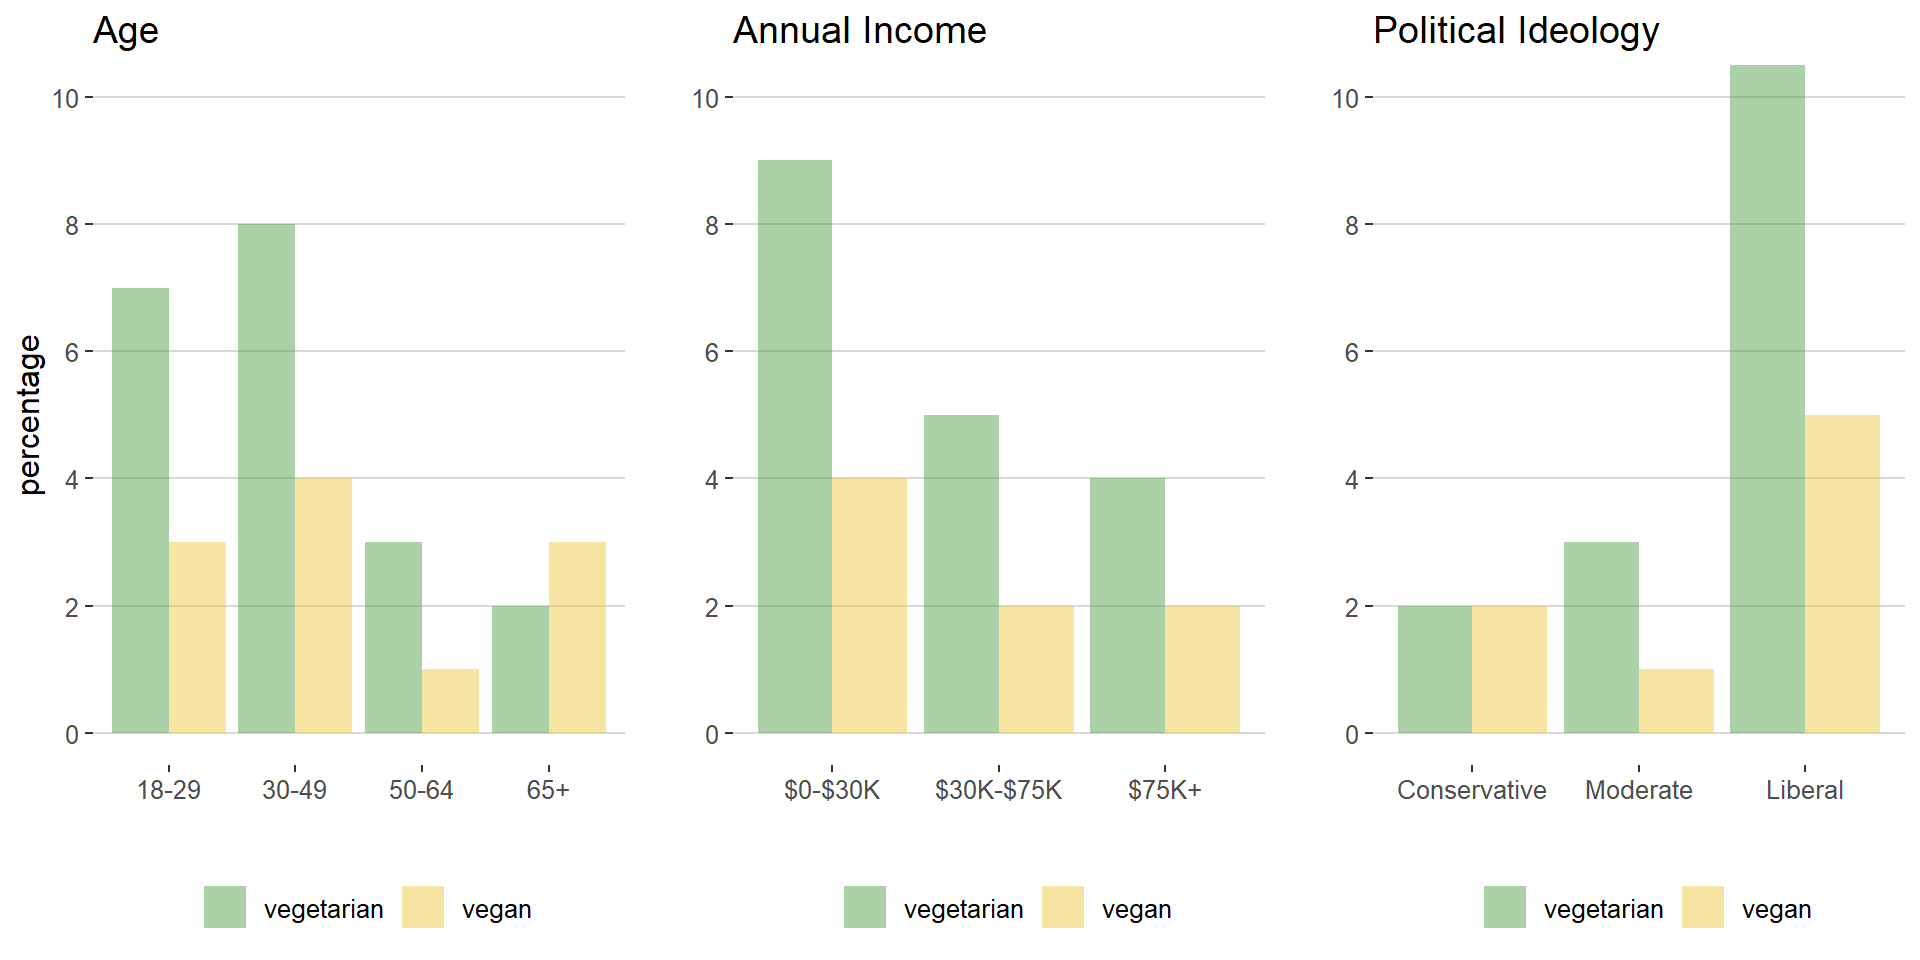
Relatively younger people seem to be vegetarian or vegan. Surprisingly, relatively low-income people are more likely to be vegetarian or vegan. In addition, liberal people are more like vegetarian or vegan than conservative people.
Data Visualization (QMSS Spring 2020) Group F: Vegan
Please do not hesitate to give us your feedback ❤
Source files and process book.